The third Belgian Smart Energy Cities Network training/coaching workshop in October 2014 covered the theme of energy or heat from wastewater or “rio-thermal energy” as it is called in Dutch speaking countries. The workshop included four presentations: two from VITO; one from EANDIS; and one from VLARIO, the external speaker responsible for wastewater management in Flanders, and recently also an energy provider.
As always, the workshop was preceded by a plenary session where an overview was given on the state of play of the opportunities at EU level. In addition to this a new project on Financing Local Climate Plans was introduced.
State of play on Smart Energy Cities at EU and Flemish level
Guy Vekemans gave an overview of the living lab portfolio of Energyville:
The presentation can be viewed and downloaded here.
District development and energy maps
Next followed a presentation on dynamic district development, energy maps, collective renovations and transport policy modelling:
The presentation can be viewed and downloaded here.
Learning Network Financing of Local Climate Plans (Annick Gommers, Technum-Tractebel)
The Flemish Smart Energy City Network aims to be open to all initiatives related to the development of smart energy cities. All cities in the network have Climate Plans and/or SEAPs in place and are working on revisions. One of the big issues remains the financial aspect of these plans (see the state of sustainable city planning report). The consortium Technum-Summa-VITO is funded by the Flemish Government (LNE-CAPLO) to further develop a local financing scheme for these plans based upon a pilot that has been developed together with the cities of Antwerp and Ghent.
A learning network on financing local climate plans was established at the end of October 2014. The scheme will then be developed in phases, using the input from many stakeholders. This will result with the final version of the scheme being available to all Flemish communities and cities wishing to find a solution to financing their plans.
The complexity and process of developing a balanced financial part of a SEAP was illustrated with concrete examples and the draft scheme is available upon request from annick.gommers@technum-tractebel.be.As preparation towards the kick-off event on 23/10 some working questions were gathered assist in the process of the Learning Network Financing Local Climate Plans.
The presentation can be viewed and downloaded here.
The workshop
Energy demand maps – Michael Casier (EANDIS)
Michael Casier presented the Energy Demand maps which are being developed at the request of the Flemish Energy Agency by the Flemish Grid Distribution companies.
The energy demand maps include the energy demand for heating, domestic hot water, cooling and electricity for other purposes (lighting and electric appliances). All of these categories are shown for both industrial and non-industrial sectors. Two pilot maps have been produced for the cities of Antwerp and Ghent and a complete heating and cooling map for Flanders is under development. This map which will be finalized by February 2015 and will be used to comply with the Energy-Efficiency Directive 2012/27/EU to implement art. 14. Based upon the energy demand map a cost-benefit analysis will be conducted by the Flemish Energy Agency and VITO. The latter is planned to be finalized by end 2015.
 | The energy demand maps (in the 4 mentioned vectors and 2 sectors) will provide the energy demand in kWh, in rasters of 100m by 100m (300x300 for the industrial sector). For the pilot maps, rasters of 50x50 (250x250) were used. The results from the pilot maps look very impressive. Comparisons with other GIS layers can help create many practical tools (land use, population density, energy supply etc.). The potential for district heating is one of many the examples which resulted from the pilot map production. |
EANDIS is very happy to discuss other practical uses with cities and other stakeholders.
The presentation can be viewed and downloaded here.
A Dynamic Energy Atlas for Cities and Regions – Guy Engelen (VITO)
Guy Engelen presented the dynamic energy atlas for cities and regions which VITO has developed. The Atlas allows for a multitude of functions as follows:
- Interactive or dynamic analysis of energy and energy potentials;
- Demand and supply can be easily combined;
- Both current as potential;
- A model with integrated GIS functionalities;
- Allows for consulting and experimenting with policies and parameters and to quickly see the results of policy options;
- Flexible on scales and constitutions;
- Allows for data storage per period to allow for assessing the evolution both backwards as forwards;
- Easy-to-use, but technical.
| The presentation showed a practical application of the atlas which was developed under commission of ‘Ruimte Vlaanderen’ (administration for environmental planning) against the background of the accruing demand for space for renewable energies: Energy Landscapes. The flexibility of the tool allows for Ruimte Vlaanderen to assess the implications of specific policies and parameters used. In contrast to the classical atlas the tool allows for inputs, adaptations, calculations and experimentation. | 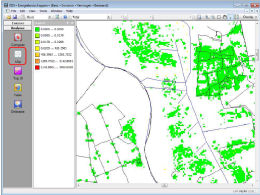 |
At the moment, the data included in the tool contains current energy supply and technical potential to allow for experimentation. Further data layers to assess economical, societal and environmental potential still need to be included, as well as energy demand. Custom-made analysis modules can be included in the future.
The presentation continued with examples of possible applications and concluded with another enumeration of the many practical assets of the tool.
The presentation can be viewed and downloaded here.
Energy from Wastewater, the experiences from a pilot project In Leuven and the INNERS project – Wendy Francken (VLARIO)
Wendy Francken presented the INNERS project (http://inners.eu/), an INTERREG IVB NEW project with a triple helix of partners from the UK, France, the Netherlands, Germany, Luxembourg and Belgium on increasing the sustainability of the water cycle by using it for energy production, energy re-use and energy efficiency.
The project unites 13 other projects aimed at:
- The assessment of the energy balance of the urban water cycle;
- Demonstration projects;
- Enabling implementation by influencing stakeholders;
- The identification of barriers to innovative techniques.
One of the demonstration projects is the Energy from wastewater recuperation project by the social housing company Dijledal, the city of Leuven, Blue Heat and VLARIO to use this heat for a central heating system of 91 living units in 3 apartment buildings.
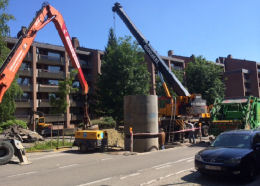 | The feasibility study included: 1) an analysis of the apartment blocks on heat losses, existing heat delivery systems in the apartments, heat demand in winter etc.; 2) an analysis of the available heat in the sewers (temperature, water flow, water height). An average temperature of more than 19°C was measured thanks to the wastewater provided by the University Hospital upstream. The latter was measured in summer and needs to be complemented by a winter measurement, though there should be enough temperature inertia in the subsoil and with the bonus heat flux from the hospital to be confident it will work. The system is widely used in Switzerland too. |
On the technical side; the system requires a pump well on public domain, in which filtered wastewater from the sewers will be pumped in and out, a 250kW heat pump (heating curve 45°C) with a backup of condensing boilers (500kWh!) on natural gas, a heating buffer and re-dimensioning of some radiators. Two circuits will be used; one for domestic hot water where the heat pump will be used for the preheating, and another one for heating. It is expected that the heat pump will supply at least 50-60% of heat demand during the year.
A new management system and building and planting rights need to be developed and the water treatment company has become and energy supply company as well. Many more applications for heat pumps combined with the water cycle in an urban environment are possible: including heat from rain water or even cooling from rain water.
More info: http://inners.eu/news/leuven-first-municipality-belgium-recovers-heat-sewage-water/
The presentation can be viewed and downloaded here.
Wastewater to energy potential mapping - Erwin Cornelis (VITO)
Erwin Corneli explained the different steps in the energy from wastewater mapping process and the specifics of such technological systems. An energy-from-wastewater potential map can be derived by combining demand maps, like the ones provided by EANDIS with information like dry weather flow rates and temperature, which are the main parameters to determine the supply of heat from the sewers. As touched upon in the previous session, disconnected flows for rain water sewers and dry weather sewers increase the efficiency of the system, but it was also important to look at the effect of rain water on the temperature of the sewer water in case of non-disconnected sewers. Depending upon the weather situation these rains could have an effect on the heating potential. Therefore even higher potential exists in the case of connected sewers are those with high flow rates and those close to the discharge points. | 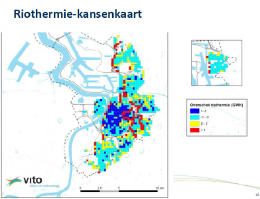 |
To produce the heat supply map, threshold values for the critical parameters needed to be determined and measurements integrated. In next step the supply map was combined with demand maps and the wastewater to energy potential map for Antwerp was produced. Four wastewater to energy systems, and their technical specifications, were shown and discussed.
Now that the potential and the technological specifications of different systems are known, the city can use this knowledge for potential project areas. There are ways this can be approached: When an area needs to be redeveloped an examination can take place as to whether there are sewers with a high potential present (demand side angle), or when sewers need to be renovated it can be looked at whether there are potential users (supply side angle). Either can result in sewers with the technology discussed.
The presentation can be viewed and downloaded here.
Further materials can be found here: (in Dutch only)
 GIS gebaseerde energiekaarten FINAAL.pdf
Kansenkaart Riothermie Antwerpen FINAAL.pdf