One very specific application of energy mapping that can highlight the need for increased insulation measures is thermographic imaging. Thermographic imaging allows for detection of energy or heat losses through the detection of infrared radiation. Think night vision goggles!
When attached to a small aircraft and after analysing images, heat loss and thus poorly insulated roofs can be easily detected. Just a small interpretation key is required to take into account the material the roof is made from and whether it is flat or a tilted, makes it possible to verify the effectiveness of the roof insulation.
The tool has been very popular for a few years in Belgian cities. Cities like Ghent, Antwerp and its surrounding communities, Brussels, Genk, Ostend and Leuven have launched initiatives to raise awareness among their citizens and get them to improve the insulation of their roofs or attic floors. Belgium has one of the most poorly insulated residential buildings stocks in the EU and when considering that approximately 30% of heat is often lost through the roof, this is a crucial point.
This kind of energy mapping requires an aircraft with a thermographic camera, a clear winter evening sky and volunteers to measure the temperature under their roof to calibrate the radiation with the measured temperature.
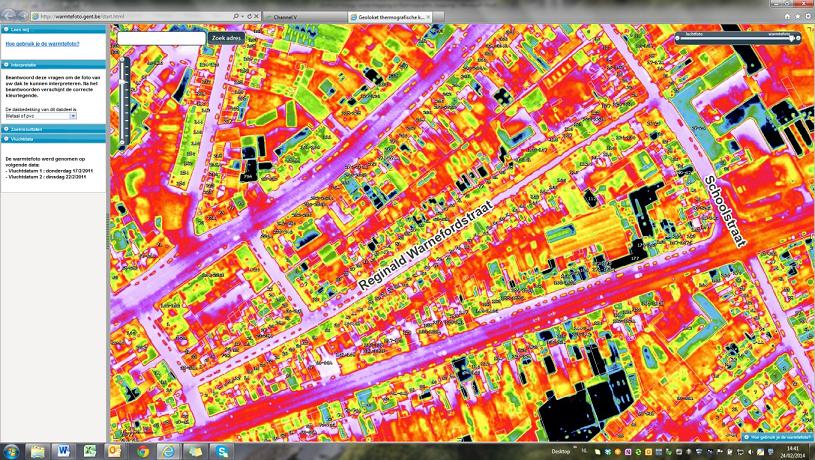
As you can see in the links below, some cities make these images available on the internet and allow you to insert your address and by answering 1-3 questions allow you to check the condition of your roof insulation. Others provide the interpretation already for you and some cities require you to contact the administration to request the images to assess the condition of your roof insulation. However all link the tool to the many possibilities of receiving personalised advice and information on the different subsidies available.
For some examples of themographic mapping accessible to citizens, see the links below. Please note they are either in Dutch or Dutch/French, but the functionality of the maps for analysis of roof heat loss is universal:
Ghent's website: http://warmtefoto.gent.be/start.html
Greater Antwerp's website: http://zoominopuwdak.antwerpen.be/
Brussels' website: http://www.gis.irisnet.be/bxlheat/