In order to provide a sound and spatial evidence base for the enhanced Sustainable Energy Action Plan (SEAP) in Glasgow, Glasgow’s STEP UP partner, Scottish Power Energy Networks (SPEN) has mapped the energy consumption of Glasgow’s buildings using a Geographic Information System (GIS).

Glasgow City Centre
The GIS maps enable spatial representation of electricity and gas consumption data for each building in the city. The maps are based on a model which estimates energy consumption based on assumptions for building features such as; building location, size (gross internal floor area or number of habitable rooms), use class and age. The data is used in conjunction with energy consumption benchmarks for each building type, and presented on a map to illustrate the distribution of energy consumption density across the city.
Predicting future energy demand and flows requires informed estimation of the changes in the city’s building stock over the forecasting period. This was performed using the Council’s spatial development plan, combined with construction planning data, taking account of projected changes to the city building stock. The development plan identifies areas of potential change, including:
• Residential regeneration of brown field land
• Urban renewal of current residential areas
• Greenfield site release for new residential development
Specific planning applications identified specific developments including:
• Major housing developments
• Waste-to-energy plants
• Large office developments, and
• Major retail sites
A draft data template was developed in the form of an excel spreadsheet, ensuring the data required to map energy consumption was identified and captured. Data to populate the spreadsheet for current and future projections was sourced from ordnance survey (OS), mapping data (OS is the UK’s mapping authority), commercial firms specialising in supplying datasets and from planning applications available on the Glasgow City Council (GCC) online planning portal, as well as summary development reports generated separately by GCC. These sources provided numbers and types of residential dwellings, and floor space and types of non residential development.
GIS was then used to attribute an annual energy consumption figure to each address shown on the OS map of Glasgow, and produce Energy Demand distribution maps (or ‘Heat’ maps). Based on this data, GIS is able to produce demand distribution maps, with each map or ‘layer’ representing combinations of current and forecast demands for domestic and/or non-domestic demand for gas, electricity or both.
An example map displaying total annual energy demand for gas and electricity for residential and non-residential properties is shown in figure 1 below:
Fig 1 - Total Gas and Electricity consumption in Buildings (Residential and Non-Residential)
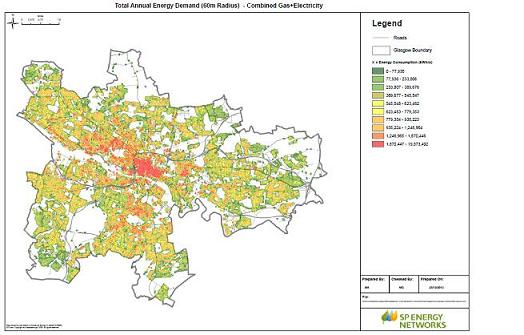
The map shows high levels of energy consumption in the areas of the city with highest building density, with the city centre itself representing the greatest level of non-domestic energy demand, and the West End and the inner east of the city having the highest density of domestic energy demand.
Other GIS maps produced showed high reliance on electricity for heating and hot water in domestic properties in the inner east and north west of the city centre and surrounding areas. This indicated the presence of relatively recent medium and high density housing reliant upon electrical heating. In the UK, gas central heating is relatively common although there is a significant proportion of housing that uses electrical heating systems, these maps provide previously unknown information on concentrations of different heating systems and thus opportunities for effective change. This highlights potential areas of the city which would benefit from the introduction and use of Combined Heat and Power (CHP) or District Heating (DH) schemes. This would be beneficial both from a carbon emissions reduction and energy efficiency perspective.
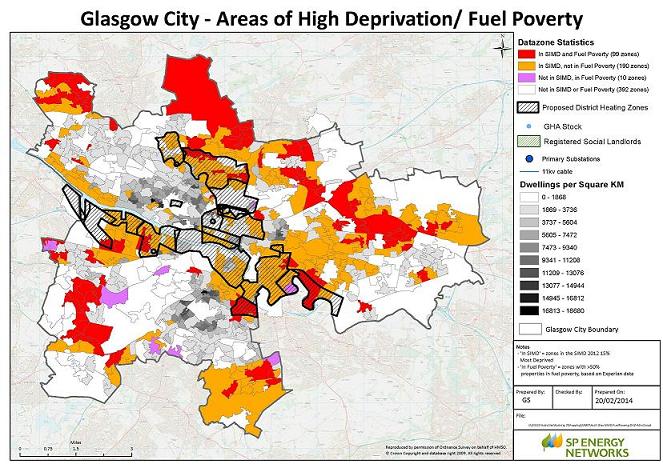
The GIS mapping tool can be manipulated to incorporate other useful data sets. One example is the use of the Scottish Government Index of Multiple Derivation (SIMD) data as shown below in figure 2. Combining this data with other maps allows the identification of areas where high levels of deprivation, energy consumption and population density coincide. These areas could offer potentially high social returns on investment made in energy efficiency measures for individual buildings and communal district heating projects. In Fig 2 below, deprivation, population density and proposed district heating zones are highlighted. It is possible to manipulate all the layers outlined in the key and in this case characteristics like ‘Registered Social Landlords’ have been removed for simplicity and clarity. Also, in the red, amber and purple areas that highlight fuel poverty and SIMD, - ‘Dwellings per Square KM’ are not visible below. It is however possible to toggle between these layers to view the characteristics of each datazone according to all the characteristics in the key.
Figure 2 - Scottish Government Index of Multiple Derivation (SIMD) – Glasgow
The GIS mapping work completed by SPEN has identified the spatial distribution of energy consumption across the city and areas that are good candidates for implementation of schemes that could improve energy performance through developments such as district heating networks. Combining energy consumption data with other datasets can also allow identification of areas that would benefit most from energy efficiency measures, assisting with the achievement of other policy goals such as providing affordable warmth.
In conclusion, this innovative spatial modelling exercise has provided for more informed decision- making with respect to the enhanced SEAP and city planning more generally in Glasgow. This will ensure that communities in the city will gain the most benefit from implementation of energy actions that both reduce carbon emissions and reduce the costs of heating for poor families.