Heat mapping can be an extremely useful tool in understanding energy usage in a city. Heating and cooling in homes, offices, public buildings, hospitals and businesses makes up nearly half of all the energy that cities use. Heat mapping is a method of assessing the demand for energy in a city and many layers of analysis can paint a very complete picture of demand that allows for informed decision making when planning energy use and infrastructure investment. Gaps in data mean benchmarks are often used to provide accurate estimates of heat demand.
The results of heat mapping analysis present a huge opportunity to planners to plan energy and other infrastructure appropriately to meet demands. For example, a cluster of high demand buildings in a small geographical vicinity could benefit from connecting to a local district heating network.
STEP UP partners have been engaged in energy mapping exercises in their respective cities and the results and outcomes are available in the menu on the Energy Mapping page.
Glasgow has produced an article on how GIS heat mapping has helped inform its enhanced SEAP and how multi layered spatial analysis can help combat issues like fuel poverty.
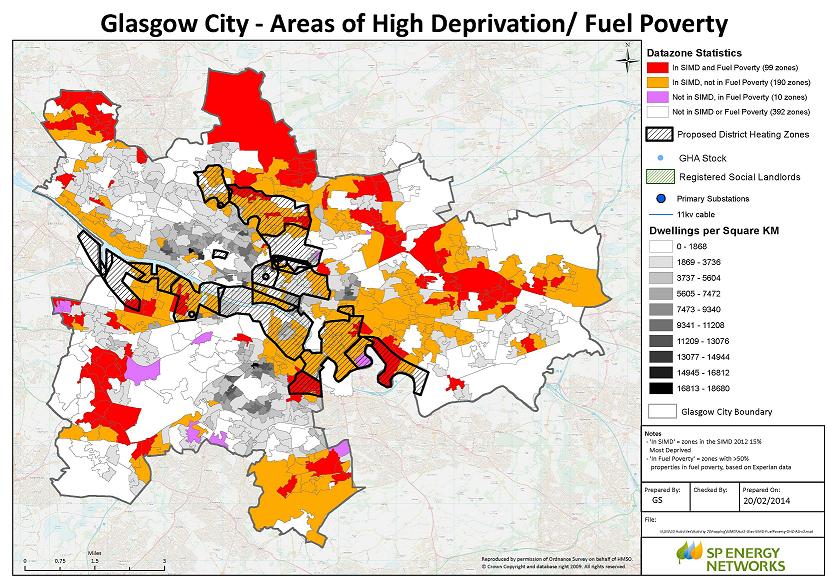
Read Glasgow's article here.
Riga has produced an article on how heat mapping analysis of energy consumption in buildings along with assessment of the buildings states can help estimate potential savings.
Read Riga's article here.
The Scottish Government has also published a draft guide to heat mapping for local government organisations.
Commercial Heat Mapping
Analysis of commercial energy usage in cities helps paint a more complete picture of where the energy demand is concentrated.
Areas of high energy demand from industrial hot spots along with retail and other commercial activity make up a considerable proportion of cities' energy use. Mapping of commercial energy use presents opportunities to maximise the impact of energy efficiency policy, by assisting commercial organisations with reducing their CO2 emissions whilst still bringing vital economic activity to their cities.
Public Sector Heat Mapping
Public buildings often act as a useful starting point for energy mapping. Municipal authorities have data on energy usage and emissions for their own buildings and consequently can identify opprtunities for lowering emissions and energy demand through initiatives such as retrofitting.
It is also easier for planners to insist on energy efficiency to be implemented in public sector buildings first. After the success of these initiatives, it is easier to use examples of energy and cost savings from public buildings to illustrate the benefits of energy efficiency policies to the commercial sector.
Outcomes
Energy mapping can identify heat supply and demand opportunities for cities. Effective use of mapping technology will also assist cities in planning their energy projects.
Crucially, heat maps can also be used to consider spatial policy options that promote energy efficiency, better heat distribution and greater use of renewable heat sources. As a tool, heat maps can be very useful when considering cross border or boundary planning issues and help assist coordinated planning.
GIS analysis allows strategy to be designed such that it targets low carbon energy measures in areas where they can have the greatest impact on reducing a city's CO2 emissions.